

Introduction
Keeping your ServiceNow instance healthy is critical to maximizing the value of the platform and your applications for your business. Over the next five minutes, I’m going to take you through eight things you can do right now that will improve the performance of your ServiceNow instance without the need to hire additional resources or cause significant downtime.
Additionally, throughout this article, you’ll find Pro Tips, links, and materials that you can take back to your respective organizations or teams that will enable you to implement processes and practices which fit your unique challenges and needs for systemic success.
Audience
This information in this article is intended for ServiceNow Administrator (s), implementation owner (s), and select users who have the role of ‘ADMIN.’
Purpose
It is a starting point to provide a workable and reference able framework that enables you to build and deliver value faster—an opportunity for you to Initiate processes and practices to fine-tune your instance regularly.
Potential Benefits
Below are just a few of the potential benefits you’ll receive by initiating a performance management program:
- Improved upgradability
- Improved scalability
- Improved uptime
- Reduction in user calls to service desk and strain on these resources.
- You’ll gain valuable agility by identity and addressing potential risks to your instance.
- You’ll have a superior, more efficient design, so you get the most value from your ServiceNow Instance.
Before We Start
For demonstration purposes, I will be using the ServiceNow Releases of Paris and Quebec. Depending on which ServiceNow release your organization is running, the information and techniques to follow may appear differently on your instance.
Now The List..
Check System Diagnostics to Troubleshoot.
- While not a method that will directly impact or improve your ServiceNow instance performance, it is an excellent place to start in understanding your ServiceNow instance and what potentially might be causing any performance issues you may be experiencing.
- The diagnostic page provides an overview of helpful information about a running instance and cluster nodes.
- Enables administrators to look for root causes of platform performance.
- Try using /stats.do to view current instance performance instantly.
- To learn more about /stats.do check out this community Post or this ServiceNow documentation page.
- ServiceNow Product Documentation

Pro Tip: Turn your system diagnostics page into a dashboard for easy access to this critical information.
Check Browser Settings and Align to ServiceNow Recommendations
- Depending on which browser your using, browser settings can affect the performance of your instance.
- Make sure you’re on the recommended browser version by ServiceNow.
- Regularly clean your browser cookies and cache.
- Refer to release notes for ServiceNow recommended browser versions.
- See the bonus information section for more insight.

Pro Tip: Use System Diagnostics >Browser to quickly access and triage browser performance issues.
Check running reports and dashboards.
- Limit the number of records that can be exported.
- Remove old or unused reports and dashboards
- Limit the refresh intervals or turn them off.
- Set your filters to limit the number of rows returned, i.e., It’s unlikely you’d need to know all the standard change requests ever created. It’s more likely you’d want to see the number of changes quarterly or the number of changes in the state of failure for the month.
- Limit the number of web service calls to external data sources.
Pro Tip: Limit the number of columns that users can export.
Check For Repeated Errors in the Error Logs
- Navigate to System log> Errors and Identify any actionable errors as well as the frequency within the warning message.
- Identify any abnormalities related to the increased volume by viewing the total number. If you see something like this “org.mozilla.javascript.gen.sys_script_include_5…you can dig deeper by looking at the errors script_include record with that sys_id.
- Look for any unusually large log files.

Pro Tip: ServiceNow logs all transactions and associated parameters, so if the number of users has ramped up or a new piece of functionality has gone live, the log files will naturally increase.
Monitor Table Growth Rates
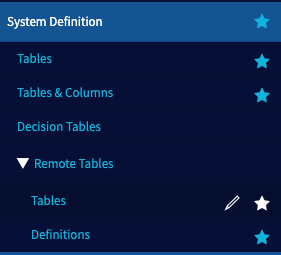
- Under System Definition > Tables, look for any dramatic changes in size from month to month.
- Now check the total number of records in your tables.
Pro Tip: To see the total size of your database and the ten biggest tables, use the Database Footprint service catalog item on the Now Support portal (HI).
Make Sure Your Scheduled Jobs are Running Properly
- By reviewing your scheduled job activity, you can help ensure those background activities, such as scheduled reports, discovery sensors, and other routine tasks, run smoothly. Check for anything that’s running for more than an hour (3,600,000 ms).
- Navigate to System Logs > Transactions (Background).
- Apply a filter with the following conditions (see Figure 3): Created > on > This week URL > starts with > JOB Response time > greater than > 3600000
- Note: The response may take several minutes to return. If you don’t return any results for an hour, try the same steps again with a more stringent value, such as a half-hour (1800000 ms). Of course, some scheduled jobs will take a long time because they have many to process. Due to how the transaction log tables are stored and rotated in the database, it is impossible to use the “group by” function in the list view. Because of this, you may find it easier to do your trend analysis by exporting the result set to Excel.
- If you see a job that has been executed multiple times for a long duration, drill down into what the problem is. The most common culprits are glide record queries, which request information from large tables with un-indexed “where” clauses or sorts/groups. Often these are found inside of scripted transform maps and sometimes inside of script includes or business rules.
Configure Scheduled Jobs to Use “Burst” Scheduler Workers
- To insulate against backed up scheduler worker queues, set the Priority field on the sys_trigger entry for the scheduled job to 25. Ensuring that the core jobs—event processors, SMTP sender, POP reader, and SMS sender—get triggered in a timely fashion. Should all the scheduler workers be busy with other jobs, an “important” job, which is more than 60 seconds past due, will spawn a “Burst” scheduler worker and execute in parallel to the core eight schedulers node.
Pro Tip: Using “Burst” scheduler worker is good insulation, but don’t use it as an excuse to avoid addressing the root causes of the other long-running or high-volume scheduled jobs.
Clean Your Tables
- When you look at your temporary data tables, make sure you see evidence that a sensible data retention policy is being enforced. If a record is a throwaway, there’s no need to retain it once it’s processed. Set up a table cleaner to remove the row in a timely fashion. With the advent of solid-state drives, the table cleaner can comfortably delete approximately one million rows from a table daily and keep up. When you need to purge more than one million rows at a time, you may need to request a table rotation. Table rotation is part of the Now Platform functionality. While it’s open to users with the admin role, we recommend sending a ServiceNow technical support team ticket to investigate your requirements.
- To list the data you may want to purge (such as incidents older than one year):
- Type incident.list in the left navigation field, or type servicenow.com/ incident_list.do into your browser’s address bar.
- A count of the records will display.
- You may want to amend your show x records preference to 10 or 20 to speed up the list rendering time.
Pro Tip: If you discover that you need to purge more than one million records, submit a ServiceNow tech support team ticket to handle the purge. Purging them yourself could cause an outage or other issues.
Bonus Information
- Download the ServiceNow Instance Performance and Maintenance Playbook
- Review ServiceNow HI for open or resolved issues.
- Download the ServiceNow Health Scan information Chart
- Search the ServiceNow Community for articles like this one by Gowrisankar Sativada
- Read ServiceNow information documentation for Platform Performance
Still, have Questions? Need Help?
Contact ME with questions or requests.


You must be logged in to post a comment.